SIBELIUs Visualisation Demonstration Video
Overview
Welcome to the SIBELIUs visualisation website. The aim of this website is to provide access to environmental information that has been derived from satellite data. The main categories of information are pasture, snow, drought, and temperature. In addition, visual images provide a true colour representation of the terrain, as seen from the satellite.
Geographical information is also available, to help navigate and see the context in which the environmental information resides. A search facility is also provided, to help locate regions. If the user logs in using a Google account, it is possible to use the 'Export Map' and 'Upload' functions, which enable downloading of imagery and uploading of GeoJSONs.
The satellites used to derive the environmental information fall into two categories: high resolution and low resolution. The high-resolution images are based on pixels of 10 m x 10 m and are derived from the European Space Agency’s Sentinel-2 satellites and NASA’s Landsat-8 satellites. The low-resolution images have pixels of 250 m x 250 m and are derived from NASA’s MODIS instruments onboard the Terra and Aqua satellites.
The high-resolution images have the advantage that lots of detail can be seen in them. The low-resolution images have the advantage that they are acquired much more frequently, which means there is a better chance of finding data which is free from contamination by cloud cover.
The SIBELIUs visualisation website and its contents have been developed by government organisations in collaboration with the SIBELIUs project team.
Menu Items
Home
About Website
Data
![]()
User page
Login/Logout
– this is the page you will see at the start
– Brief information about this website
– information about the data shown on the map
– a link to the SIBELIUs Facebook page
– User page
– to login to the site or logout
Map
On first accessing the website a disclaimer will display. Click ‘Accept’ to clear the disclaimer and use the site.
Map Elements
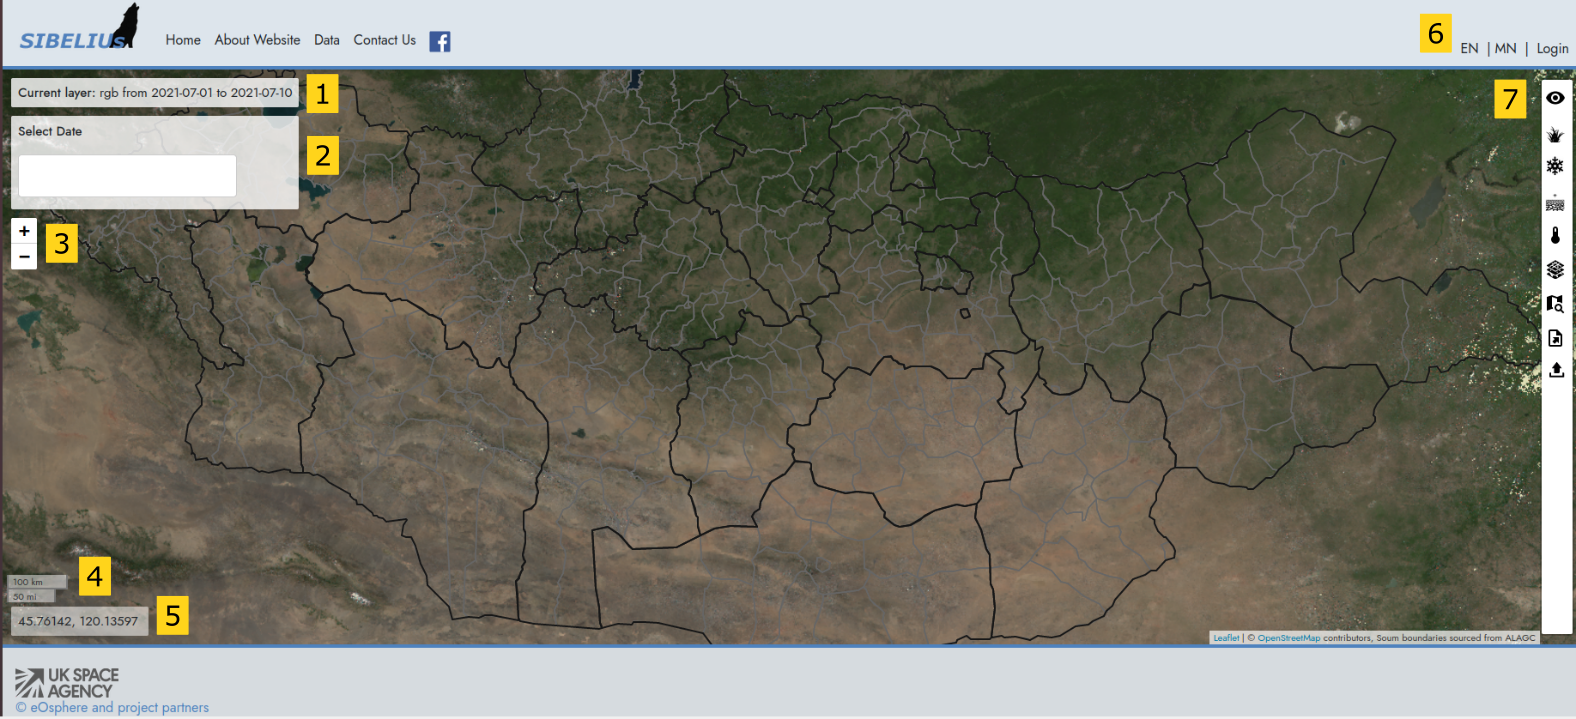
- Current layer display. This shows the current layer shown on the map. The type of layer and the date for the data is displayed.
- Date Selector. This allows you to select a different map time.
- Zoom controls. These allow you to zoom in and out of the map.
- Scale bar. This shows the scale of the map.
- Mouse position. This shows you the coordinates currently being сovered over in the map.
- Login and language selector. This allows you to login and change the language displayed in the map.
- Side panel control. Clicking on one of the buttons expands the side panel and shows additional functions.
Showing a greenness graph
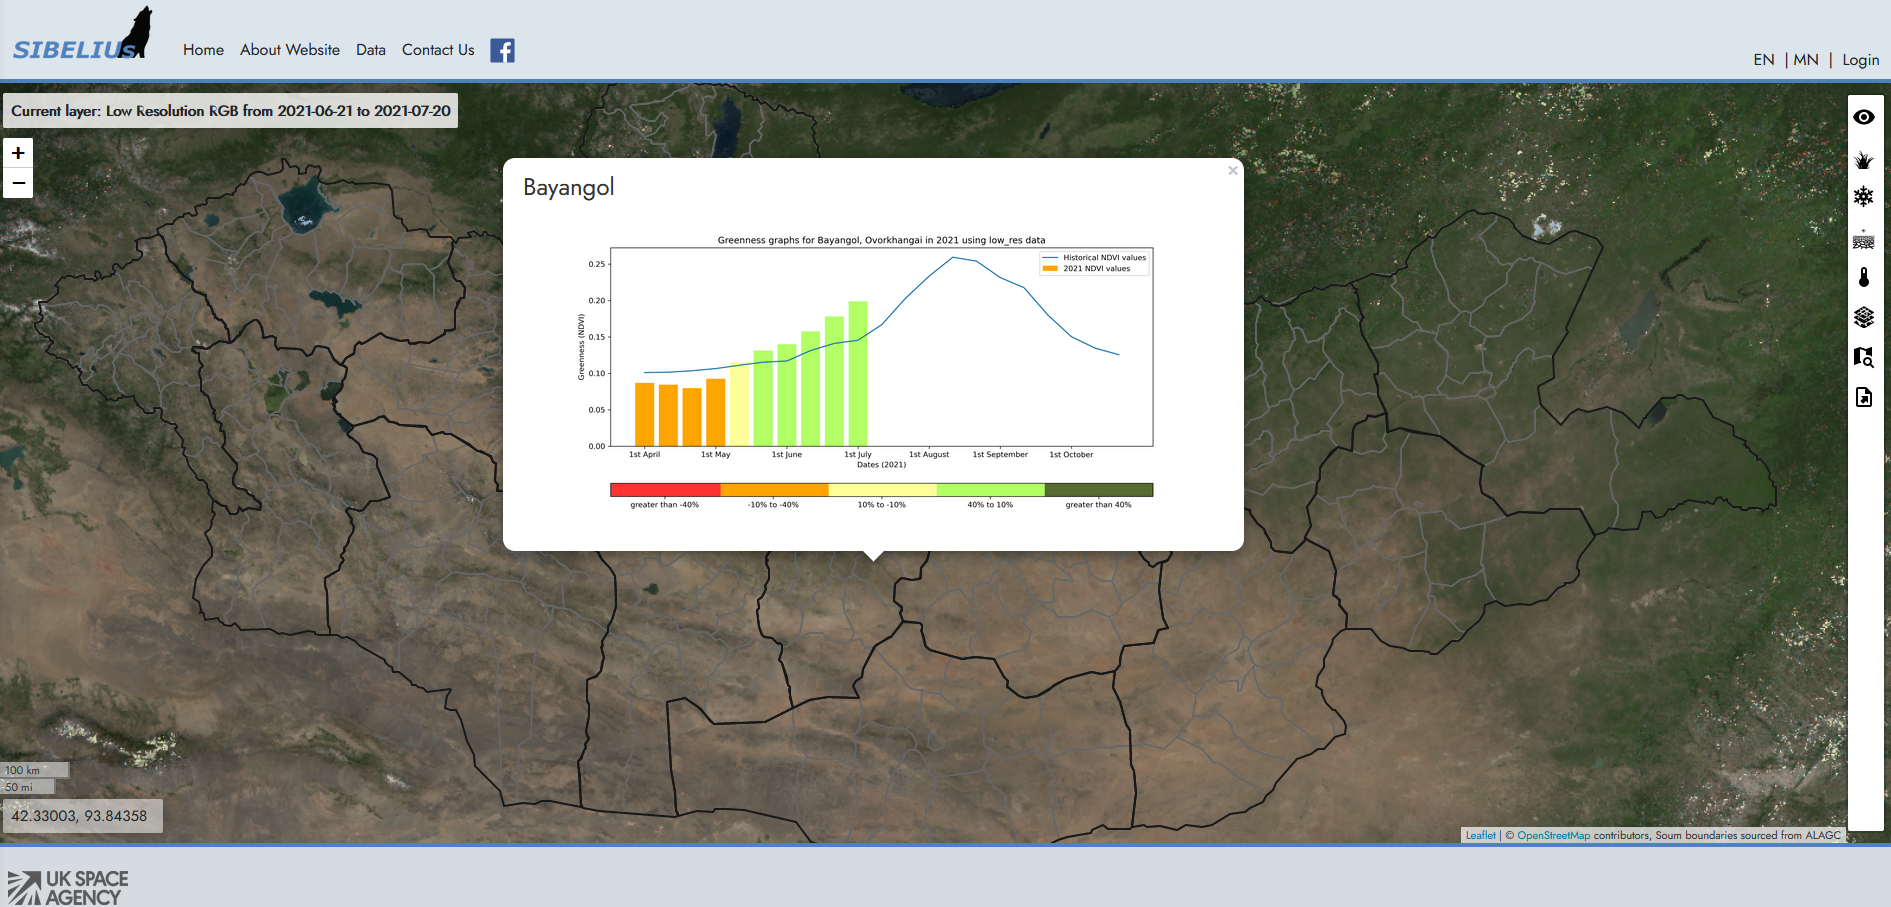
Clicking on a soum will show a greenness graph. A greenness graph shows you this year’s pasture conditions compare to the usual conditions in this soum. A satellite’s measure of greenness (the NDVI index) is usually a good indication of the health of the pasture. The usual conditions are calculated using MODIS satellite data acquired between 2009 and today.
Side panel controls
Clicking on any of these controls expands the side panel. Clicking on it again closes the panel.
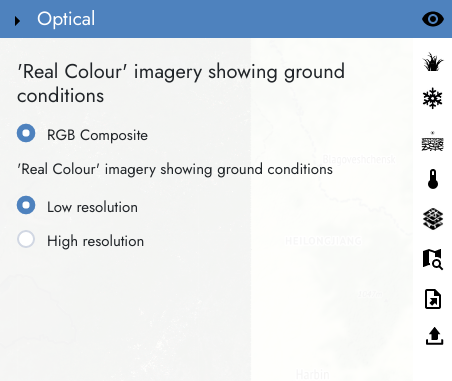
Optical (RGB)
This option allows you to select which layer of satellite Optical (RGB) images are displayed.
The layers images can be turned on and off using the check box to the side of the layer image name.
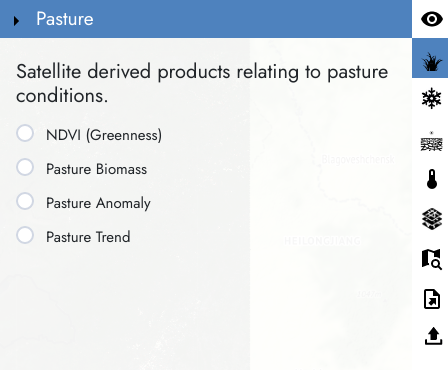
Pasture
This option allows you to select which layer of satellite Pasture images are displayed.
The layers images can be turned on and off using the check box to the side of the layer image name.
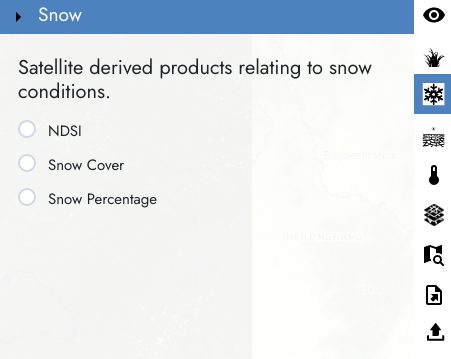
Snow
This option allows you to select which layer of satellite Snow images are displayed.
The layers images can be turned on and off using the check box to the side of the layer image name.
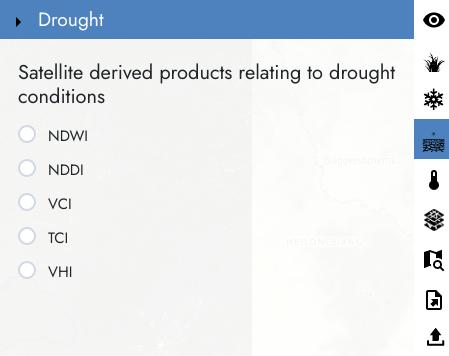
Drought
This option allows you to select which layer of satellite Drought images are displayed.
The layers images can be turned on and off using the check box to the side of the layer image name.
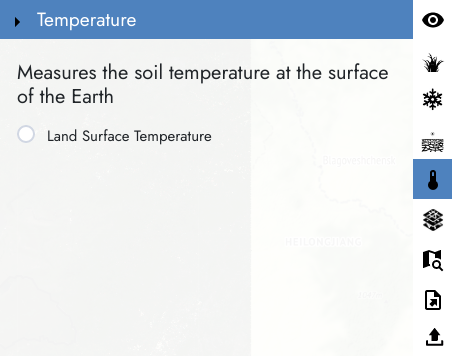
Temperature
This option allows you to select which layer of satellite Temperature images are displayed.
The layers images can be turned on and off using the check box to the side of the layer image name.
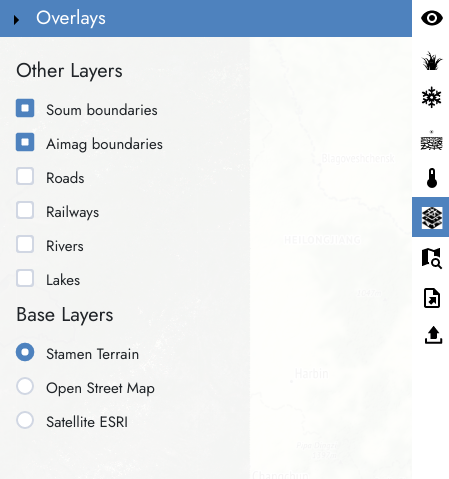
Geographic data
Here geographic data are provided. These can be turned on and off using the check box to the side of the name of the information.
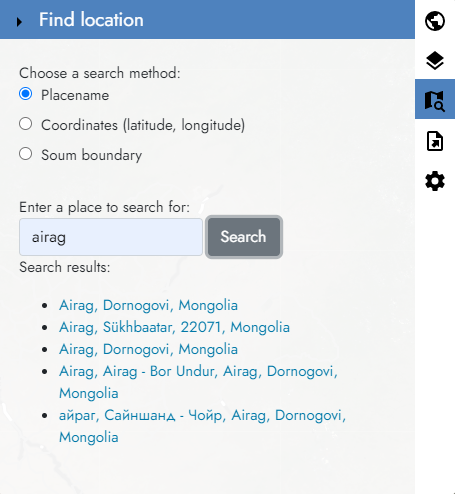
Searching
There are three ways to search for locations on the map
- Place name Type a place name into the text box, hit enter and a list of possible matches will be shown. Click on a link to zoom to that location.
- Coordinates Enter coordinates for latitude and longitude to move to that location. The zoom level will not change.
- Soum boundary Select an aimag and then a soum from the options to zoom to the extent of that boundary.
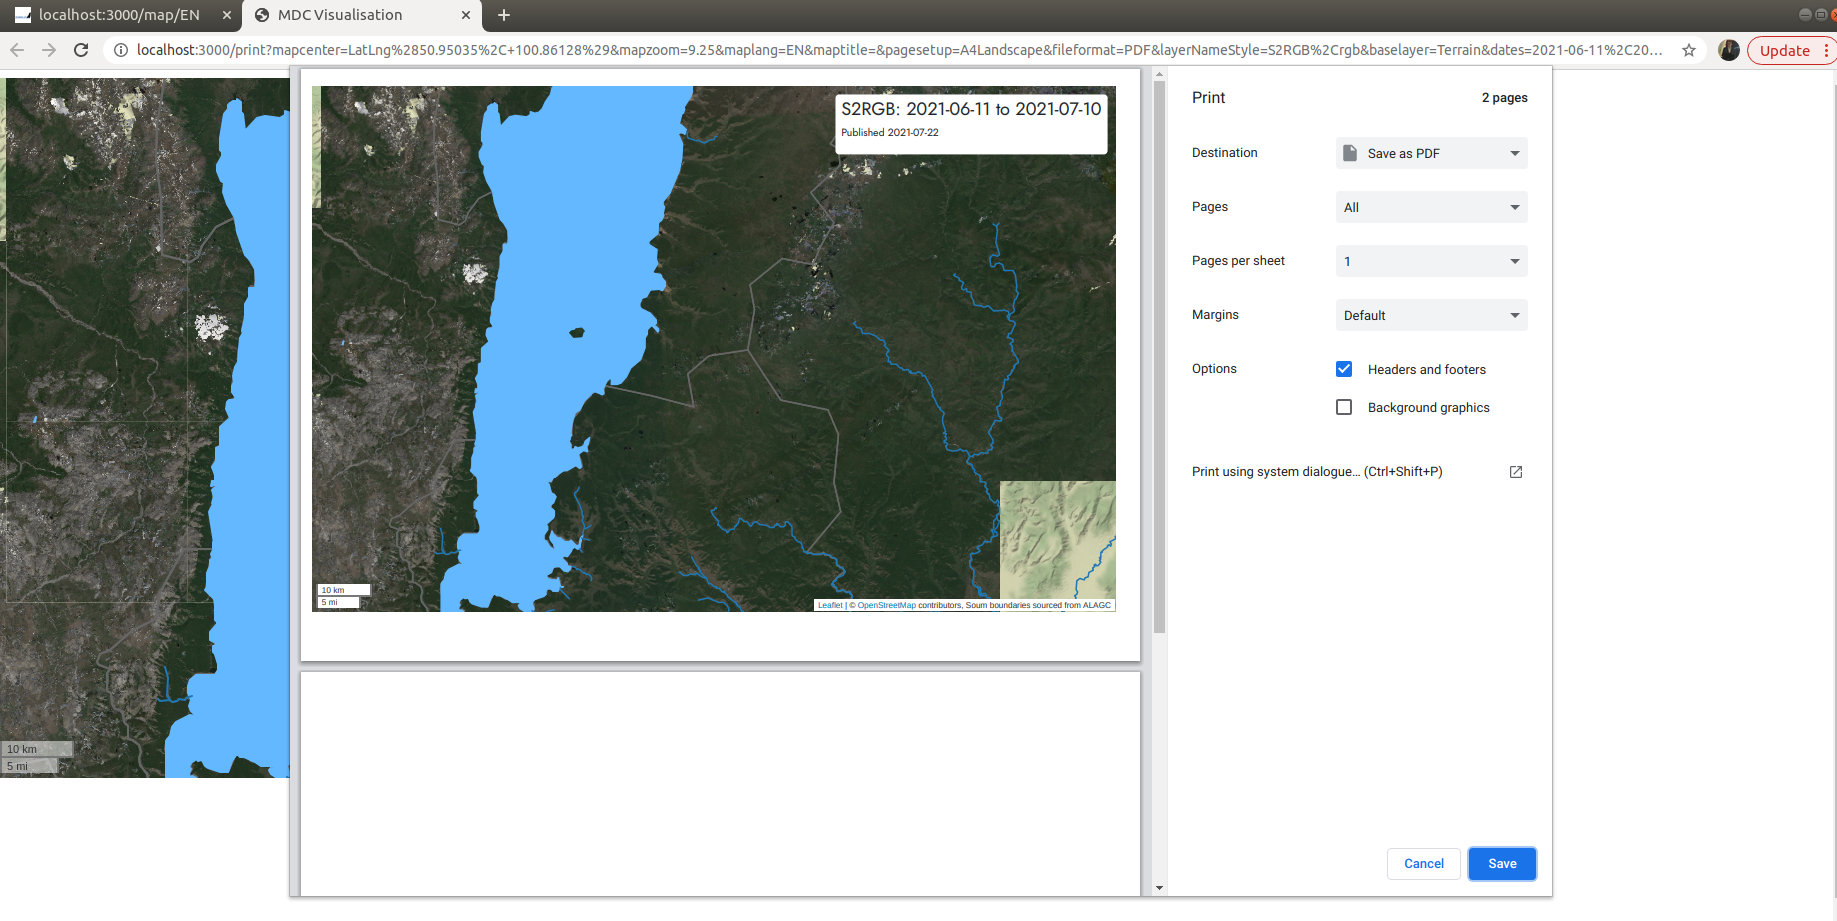
Exporting a map
You need to login to be able to export a map. We ask you to login solely so we can understand how many people are using the SIBELIUs visualisation system. Not because we want to contact you.
This tool allows you to export a map of the current view showing the current information. A title can be added, otherwise information from the current view will be used to create the map to export.
This map can be printed or saved as a pdf or GeoTIFF.
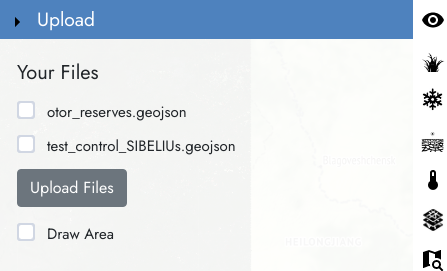
Upload
You also need to log in to upload a file. Once you've logged in, you are able to add and view your own GeoJSONs in the map